 Skip to content
Before we go deep into the science of Bell Curve in performance appraisal, let’s consider: Is it fair to categorize your employees in boxes designated as ‘top performers’, ‘average performers’ and ‘non-performers’!
Every manager wants to recognize top performers and help others grow, but drawing that line is not easy. Though the Bell Curve promises fairness, but often sparks up debates about bias, morale, and true performance. And thus, its impact on employees and workplace culture remains widely debated.
There are several opinions, both for and against this concept. Read this post to understand its significance for your workplace.
Table of Contents
What is a Bell Curve?
According to Google, the term “bell curve” is defined as “a symmetrical, bell-shaped graph that represents a normal distribution of data.”
To put it simply, it assumes that most employees perform at an average level, with a few excelling and a few underperforming.
For instance, in a sales team, the Bell Curve may reward the top 10% of employees who exceed targets, recognize the middle 70% for consistent performance, and identify the bottom 20% for improvement. Though this approach will guide HR and managers in making decisions on promotions and rewards, but it also raises questions about true performance management.
Let us now understand this further using some basic statistical concepts.
Let’s assume you have a large data set. It could include employee earnings, age, performance appraisal scores, and number of defects per 1000 items.
You want to look at this data to understand the patterns better, predict future outcomes, and take proactive decisions. So what are the ways to analyze patterns? Let’s see them.
Gut feel: While followed most frequently, and often based on our past experiences, this is the least scientific method to analyze data.
Mean: You find the average of the data set and use that for predicting behavior. However, this often fails, since very large (or very small) values can skew results.
Scatter or cluster chart: This can give an idea of where most of the values are. But you cannot analyze the data further.
Median: You set things in a sequence and then find the midpoint. This avoids the problem with mean, but still doesn’t allow analysis.
Bell curve: Using a statistical package or a spreadsheet program, you can quickly determine standard deviation. In addition, you can also draw a curve of the population. This curve is called the bell curve. Standard deviation implies how spread out the numbers are.
In this bell curve model, a predetermined percentage of employees are placed into various performance tiers, typically ranging from top performers to those needing improvement. This approach of bell curve performance review aims to identify high achievers and manage underperformers, but it can also lead to tension and competition among team members.
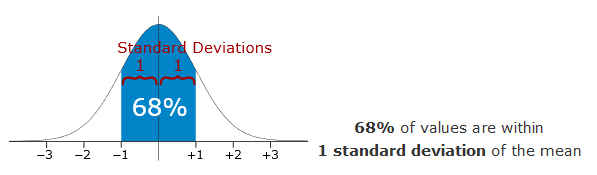
General Rules for a Standardized Normal Distribution
- 68% of the population of the data-set will lie within 1 standard deviation of the mean.
- 95% of the population will lie within 2 standard deviations of the mean.
- 99.7% of the population will lie within 3 standard deviations of the mean.
And the same can be illustrated pictorially as:
Why is the Bell Curve Used?
Let us look at a simple, practical example. This will help in clearly understanding the benefit of the normalized distribution (or a bell curve) when applied to a business scenario.
Let’s assume we have 1000 employees in our organization. We find that their average age is 32 years, with a standard deviation of 4.
Using the standardized normal distribution explained above, we can thus conclude that,
- 680 employees (68% of 1000) will be within the age range of 28 (32 – 4) years and 36 (32 + 4) years. (68% of employees will be within one standard deviation of the mean)
- 950 employees will be within the age of 24 years and 40 years (95% of employees will be within two standard deviations of the mean)
- Only 3 employees will be either less than 20 years in age or more than 44 years in age. 99.7% will be within 3 standard deviations or 0.3% will be outside this range
The normalized distribution or a bell-curve based analysis can help us in various ways.
Firstly, it can be helpful in planning employee benefits. Secondly, we can setup office environment to cater to the appropriate age groups. Thirdly, it can help to identify career growth aspirations and also project attrition, hiring needs etc.
However, just looking at the mean or median would not have helped us do any such analysis.
Similar bell curve analysis can be carried out for a variety of data points. Moreover, it is especially useful for analysing the outcome of the performance appraisals.
History of the Bell Curve in Performance Appraisal
Employee productivity has been measured since the beginning of the industrial revolution. However, the performance bell curve gained popularity when Jack Welch, the famous CEO of GE, implemented it in his organization.
The concept has various names such as stacked ranking, forced ranking, rank and yank and the vitality model. This is described as a “20-70-10” system by GE. It says:
The “top 20” percent of the workforce is most productive, and 70% (the “vital 70”) work adequately. The other 10% (“bottom 10”) are non-producers and should be fired.
On one hand, this system is credited with increasing GE revenues by 5 fold. On the other hand, it has been labeled as too harsh, affecting employee morale adversely. This even made it the subject of a fierce debate.
Each coin has 2 sides and the same applies to Bell Curve Performance Management too. Hence, let us explore the benefits and challenges with normalization of the performance appraisal scores.
Bell Curve Performance in Appraisal

Benefits of Performance Management Based on the Bell Curve
Identify Top Performers through the Performance Bell Curve Grading
The forced ranking compels managers to make decisions and differentiate between different employees.
Those who are identified as high-top performers are rewarded: thus, they feel motivated and work harder to grow in the company. Such employees are called HIPOs.
The company can develop suitable growth and career plans for HIPOs and take initiatives to retain them within the company. This not only helps retain the top talent but also helps build succession pipelines.
Removing Manager Bias
Perhaps the organizations can use the bell curve to manage leniency and strictness of managers’ ratings.
Lenient scores mean a larger cluster of employees in a high-rating group (a right-skewed bell-curve). However, the strict scores mean large numbers of employees in a low-rating group (a left-skewed bell curve).
This scoring may change from one manager to the next. Thus making the performance appraisal unfair for one group of employees.
These unbalanced scores may demotivate high performers and retain mediocre employees.
The average manager often tends to rate on a lenient scale. Use individual z-scores to remove manager bias easily.
Identify the Suitability of Employees in a Job Position
An underperforming employee may be more suited for another position in the company. The forced ranking with adequate analysis and HR intervention can help identify other positions for employees.
By analyzing capabilities, skills, strengths and weaknesses, HR can play a key role in employee development. Furthermore, they can keep employees in roles that map better to their individual capabilities.
Manage Training Needs
The training management talks about the importance of the correct allocation of training to employees. The bell curve graph can help identify the training needs applicable to different groups of employees.
Disadvantages of the Bell Curve in Performance Appraisal
Too Rigid
Using the bell curve model in performance management may be considered a rigid approach for rating employees.
Sometimes managers need to put employees in specific gradients just for the sake of bell curve requirements. This happens more often when the teams are small.
Loss of Morale
The bell curve appraisal creates anxiety for employees. They may worry about the possibility of an exit during tough job market conditions. This may lead to further deterioration of job performance.
Not Suitable for Small Companies
The performance review in the bell curve is not suitable for small companies, with less than 150 employees.
The categorization cannot be done properly with fewer employees. Therefore, the results are often erroneous.
For a long time there has been an ongoing debate on the bell curve based normalization methodology. However, inclusion of 360 feedback helps clear some of these doubts.
Conclusion and Next Steps
Many organizations have publicly opposed stack ranking. All the same, they don’t have a viable alternative for recognizing, rewarding and retaining top performers.
Moreover, companies remain unsure about the existence of challenges in employee productivity. This uncertainty stems from various factors such as employees goals not conforming to the SMART framework, or there was infrequent coaching by managers. Additionally it may result from skills gaps or other inherent business challenges.
Hence most organizations still continue with some kind of stack-ranking or bell curve performance management. They do so to identify and motivate top performers and work on developing the rest of the staff.
As mentioned earlier, you may use Bell Curve Appraisal successfully to identify top-performers. You can also use other effective tools such as 360 Feedback, Continuous Performance Management, and Project-centric evaluations. These will help to determine the capabilities, promotability, recognition, and training needs of all employees.
And at last, it is important to say that Bell Curve Appraisal should not be used to create fear or terminate employees.
Frequently Asked Questions
Q1. | Is the bell curve method of performance appraisal inherently good or bad? |
| Ans. | The suitability of the bell curve method depends on various factors, including organizational culture, goals, and the nature of the workforce. It provides a structured approach to performance evaluation and helps identify high-performing employees. This facilitates decision-making for development initiatives, promotions and succession planning. However, some experts say that it can create a toxic work environment, discourage collaboration, and undermine employee morale. Ultimately, whether the bell curve method is good or bad depends on its implementation and alignment with organizational values and objectives. |
Q2. | Are there alternatives to the bell curve method for performance appraisal? |
| Ans. | Yes, there are several alternatives to the bell curve method. These include management by objectives (MBO), 360-degree feedback, continuous performance management, and strengths-based performance appraisal. Empxtrack supports all these methods emphasizing continuous feedback, collaboration, and development rather than comparative rankings. |
Q3. | How can organizations mitigate the negative effects of the bell curve method? |
| Ans. | Organizations can mitigate the effects of the bell curve method by: ● ensuring clear communication about performance expectations ● providing regular feedback ● coaching to employees ● offering opportunities for skill development and growth ● implementing fair and meaningful performance appraisals that focus on individual contributions and achievements |
Q4. | What is the bell curve in HR? |
| Ans. | The bell curve in HR, often referred to as ‘forced ranking’, is a method used to evaluate employee performance. It visualized how performance levels typically distribute in a workforce, resembling a bell shaped curve. |
Q5. | What is bell curve performance in appraisal? |
| Ans. | The bell curve performance in appraisal assesses employee performance by classifying individuals into various performance levels. Companies use the bell curve performance in appraisal system to recognize and reward high achievers, keep top talent, and promote growth for both employees and the organization. |
Q6. | Is the Bell Curve still relevant today? |
| Ans. | Bell Curve, though once popular, is less relevant today. Organizations are moving towards more flexible and development-focused approaches. |
Q7. | Why are many companies replacing the Bell Curve model? |
| Ans. | Many companies are replacing this model because it demotivates employees by categorizing them unfairly. In addition, it promotes unhealthy competition among the employees. |
Q8. | What industries benefit most from using the Bell Curve? |
| Ans. | Industries such as IT, consulting, finance, manufacturing, and sales benefit most from using the Bell Curve. |


Keep on writing, great job!
Excellent article. Many small organizations with high aspirations often follow the best practice in the industry without realizing the limitations of replicability. Pl include me in mailer list. Thanks
Nice blog. By bell curve statistics any organization will easily get to know their employee’s position and their impact on the company’s growth.
Very well explained , each terminology and benefits to organisation and losses to employee .
When someone writes an article he/she maintains
the thought of a user in his/her mind that how a user can be aware of it.
So that’s why this post is great. Thanks!
Just want to say your article is surprising. The clarity to you have put up is simply excellent and i could assume you’re knowledgeable in this subject. Well together with your permission allow me to grab your RSS feed to stay up to date with imminent post.
Hi there everyone, it’s my first go to see at this website, and post is actually fruitful for me,
keep up posting these types of articles.